E-Commerce Reports
The e-commerce reports in etracker analytics help you to exploit the full potential of your online store! The reports look at the steps of the e-commerce funnel, the so-called e-commerce events:
Viewed in product list → Viewed product detail page → Added to watch list or shopping cart → Purchased product
The e-commerce events can be analyzed at product, brand and category level. They can be analyzed with regard to voucher promotions as well as internal advertising measures or external marketing campaigns.
The individual steps in the checkout can be visualized using the function and the report Conversion processes can be analyzed.
Prerequisites:
- To be able to analyze e-commerce data, you need an etracker analytics Pro or Enterprise Edition.
- In order to display e-commerce data in etracker analytics, e-commerce tracking must first be implemented. If you use an etracker store plugin, this is automatically integrated. Follow the instructions to measure the e-commerce events.
The most important e-commerce reports
A wide range of standard e-commerce reports are available in etracker analytics. These are divided into conversion and product performance reports.
Using the conversion reports Orders and Cancellations, individual transactions can be assigned to the campaign origin (according to the Last Ad model).
The Product Performance Reports analyze product performance:
- Renner-Penner
- Product interest
- Product tunnel
- Abandoned shopping baskets
- Product Performance
- Product Performance Onsite
- Order coupons
- Product coupons
- Product views in lists
Renner-Penner Report
The Renner-Penner Report contains a scatter plot instead of a line chart. This makes it easy to recognize the correlations between popularity and sales performance via clusters and outliers. The Y-axis of the diagram shows the views of the product detail page (number of products viewed) and the X-axis shows the product sales (number of products purchased). The top 100 products are displayed in each case. The criterion for the top 100 allocation can be changed via the drop-down menu.
Based on the ratio of the number seen to the number bought, a division is made into four matrix areas:
- Renner: Frequently viewed and frequently purchased.
- Penner: Rarely viewed and rarely bought.
- Hidden Champion: Rarely viewed, but often bought.
- Hype: Often viewed, but rarely bought.
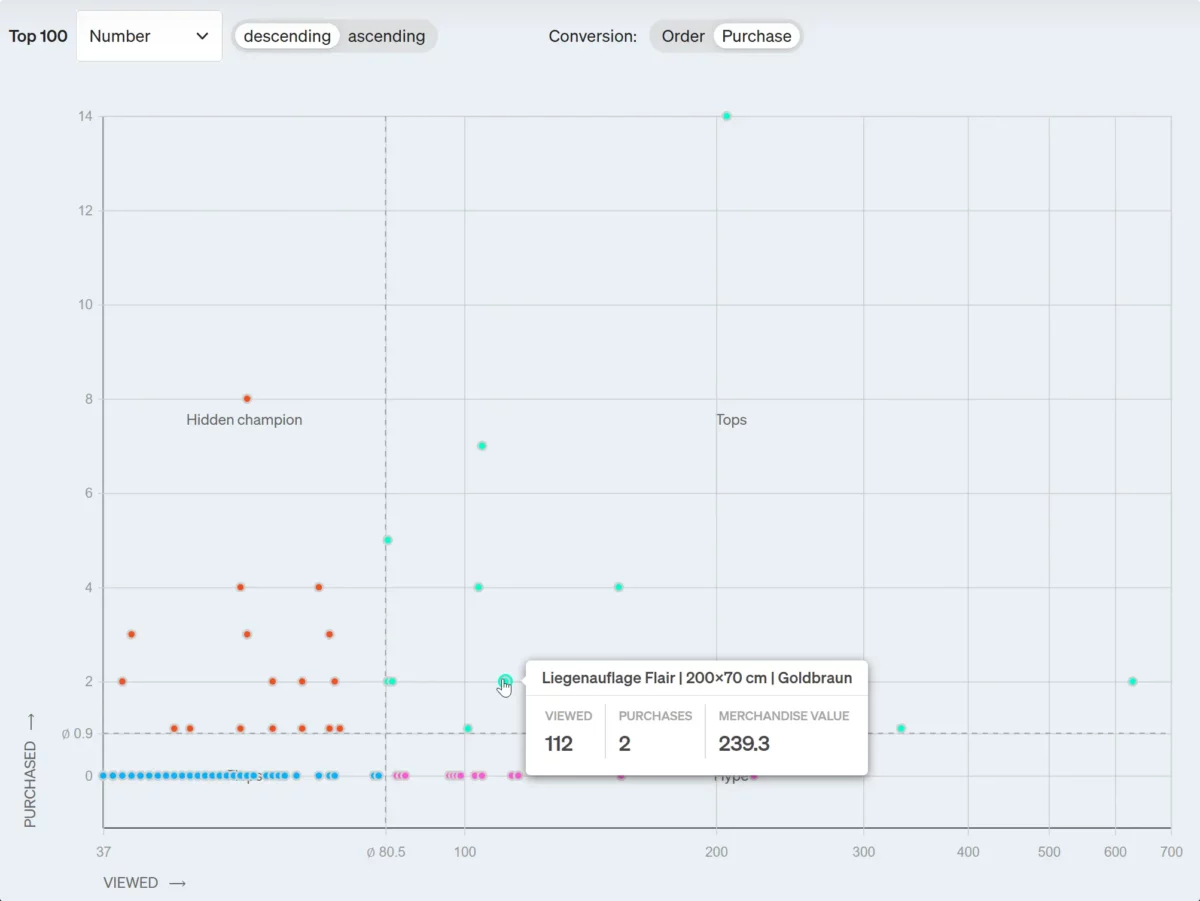
In principle, it is to be expected that the more product pages are viewed, the more frequently the products are purchased.
In stores, products can often be added to the shopping cart or ordered directly from lists without having to call up the product detail page. Nevertheless, the correlation of viewed to purchased is a good indication for optimizing product presentation, prices or availability.
Product Performance Report
The Product Performance Report is the central e-commerce report and links product data with the e-commerce events and funnel steps.
We recommend adapting the key figures to your own needs and saving them as views in order to benefit from clear reports.
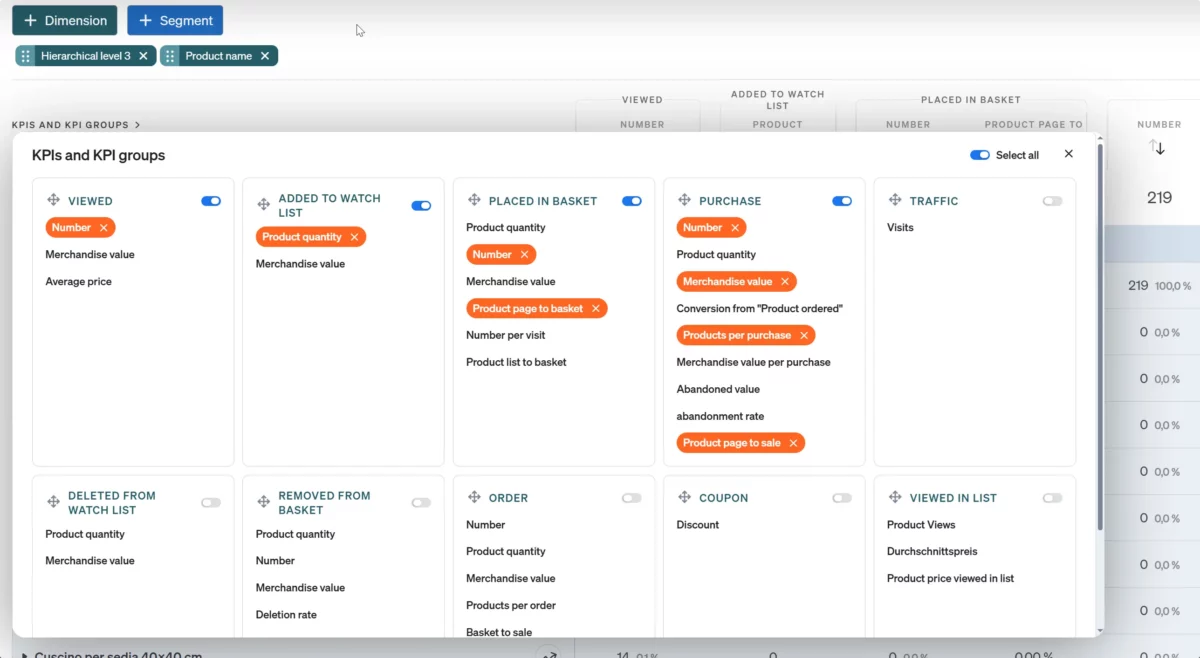
In-depth analyses can then be carried out by selecting the dimensions and segments. Select whether
- you want to evaluate on product or the different category levels.
- you want to evaluate product performance with regard to marketing channels, campaigns or landing pages.
- you want to take a closer look at certain behaviors using your own segments, such as those who view a lot of products but do not make any purchases.
Product Performance Onsite
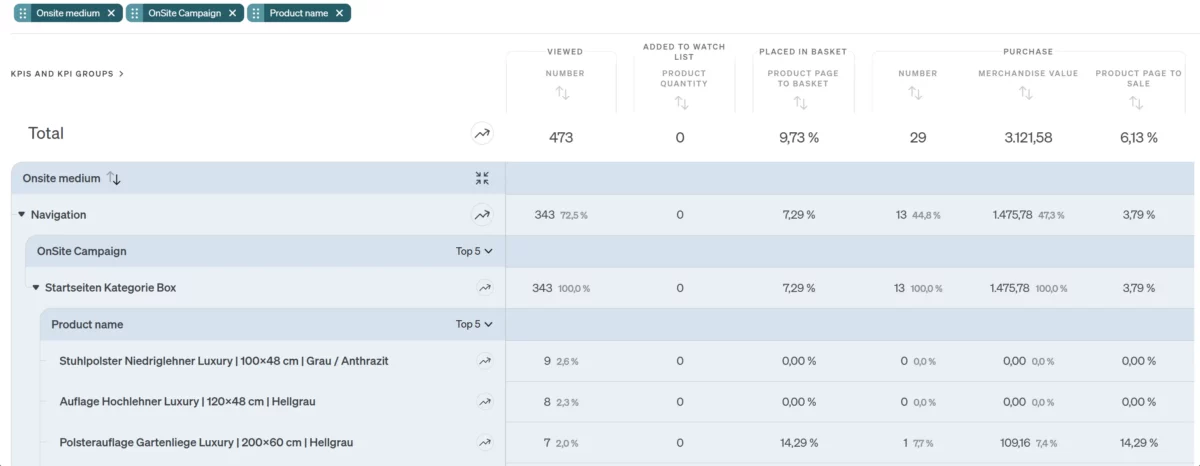
The Product Performance Onsite Report is the counterpart to the Product Performance (Offsite) Report and differs only in the attribution at the level of internal rather than external campaigns.
This enables the analysis of teasers, internal searches etc. at product level, such as the category box on the homepage:
Coupon Reports
Coupon reports provide store operators with all the important information they need to monitor and optimize their coupon strategy. The prerequisite is the implementation of suitable tracking or store plugins with integrated coupon tracking, such as the Shopware plugin.
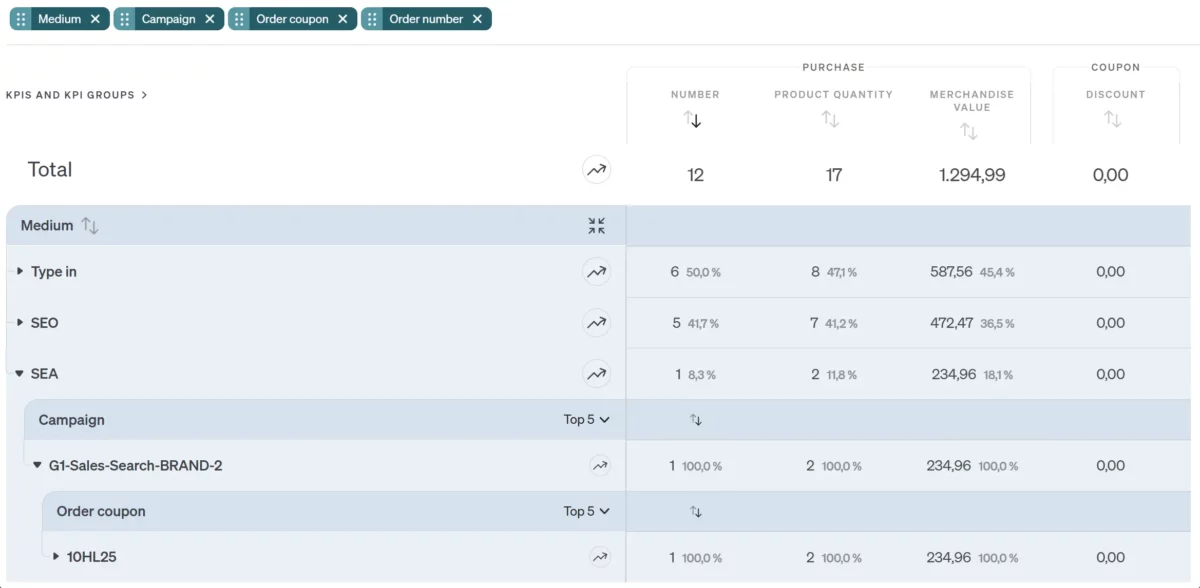
Vouchers are particularly popular as an incentive for subscribing to the newsletter. These can be order coupons that apply to any shopping cart contents or product coupons that are linked to specific items. Accordingly, there is a report for each of the two coupon types.
In the analysis, you can see which codes generate the most sales. Very often, you can also segment by article or drill down by source of origin such as medium and campaign:
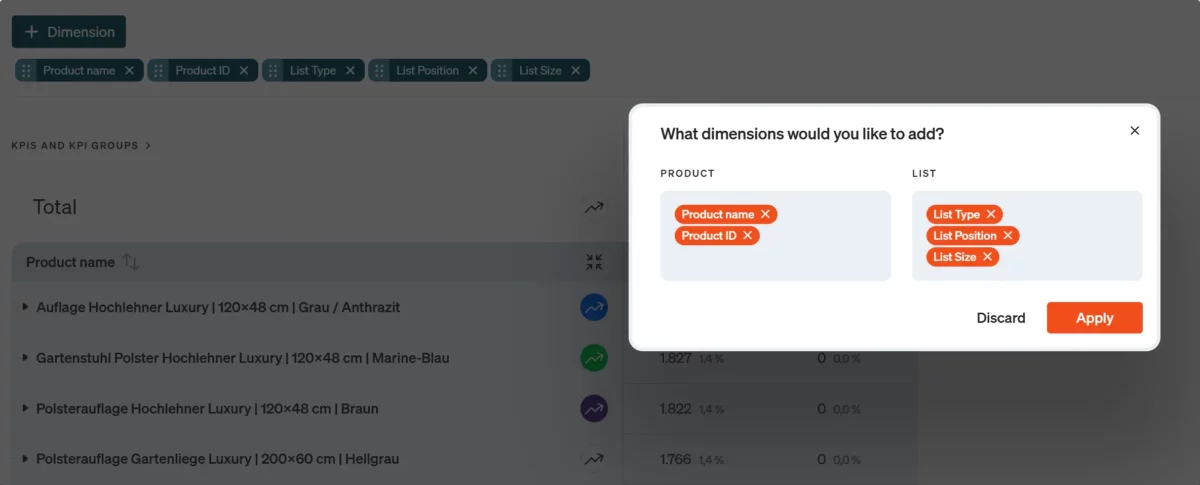
Product lists
All pages on which several products are displayed can be considered product lists. This includes search results pages as well as category overviews or lists of top sellers, new products or products on sale.
A prerequisite for the analysis is that the corresponding e-commerce event has been implemented with the transfer of associated product data.
The evaluation is possible either in the Product Performance Report via the key figure group Viewed in list or in the special report Product views in lists according to various product and list attributes.
Use the Onsite Campaigns function and the Product Performance Onsite Report to analyze list clicks and subsequent shopping cart and order events. This only shows the orders that were placed after a respective product list click.