UX Analytics
Scroll analysis
The analysis of scrolling behavior on the website is possible in tabular report form (Scrollmap Report) and as a heatmap (Scrollmap).
By default, etracker analytics automatically measures the entire length of a page and records how far and how long visitors scroll down (scroll depth) for a sample in steps of 25% (i.e. 25%, 50%, 75% and 100%).
This makes it possible to find out which elements of the page can be seen by visitors and how long the sections appear in the visible area. This is important for identifying UX optimization potential and increasing conversions.
The scrollmap (also called scroll heatmap) has the great advantage that the scroll behavior can be viewed directly in the context of the respective page content. The scrollmap report, on the other hand, offers additional segmentation options in order to understand the interaction with the page in even greater depth.
Using the scroll map
There are two ways to access the scroll map:
1. via the basic report pages and click on the scroll symbol.
2. via the scrollmap menu entry under UX Analytics → Scrollmap.
The first option is particularly helpful when it comes to analyzing pages (such as landing pages) that cannot be accessed via the website menu.
If the scrollmap is not displayed, please check the Content Security Policy (CSP). Further information on this.
In the scroll map, you can switch between the views for desktop, tablet and mobile. The most important key figures for the respective page are displayed via the report symbol. The website is fully navigable so that links can be used to call up other pages as usual.
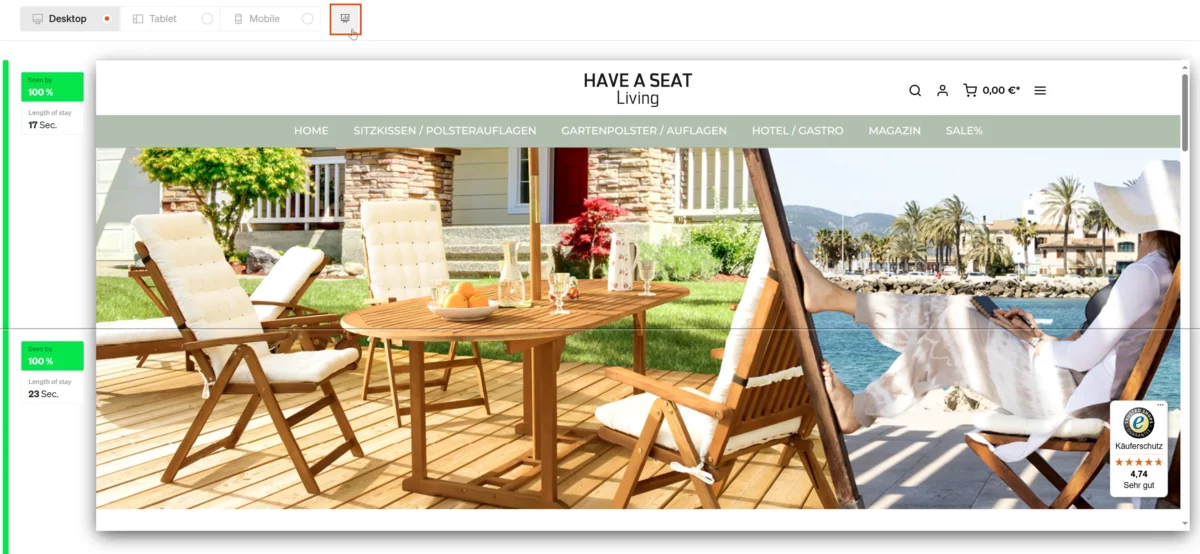
It is not unusual for the top section not to display the full 100%. This is because visitors can also jump directly to lower sections using the corresponding jump labels. Or they scroll so quickly that the etracker code is not yet fully loaded. This is often the case on mobile devices when the directly visible content is very limited.
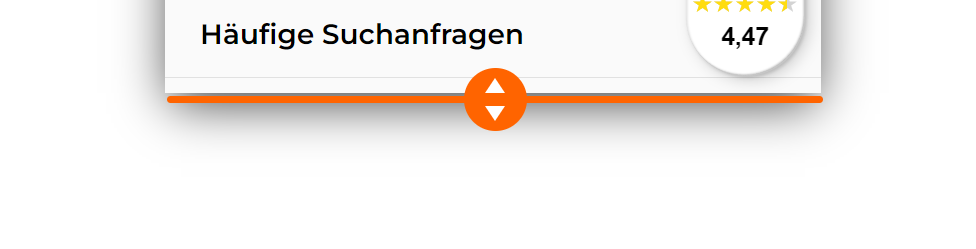
For particularly “long” pages, the initial display of the page may be cut off. In this case, simply drag the virtual end of the page downwards over the middle circle with the two arrows:
Use of the scrollmap report
Go to UX Analytics → Scrollmap Reportto open the report.
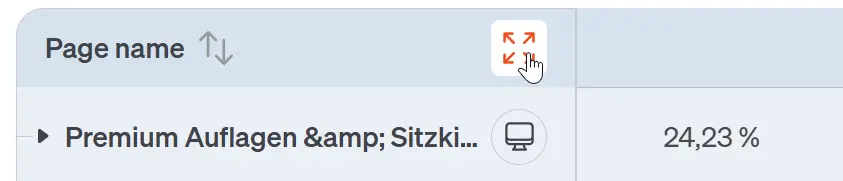
For longer page designations, use the option to widen the dimensions column:
The usual functions are available in the report, such as
- Period selection
- Sorting
- Filtering
- Unfolding pages
- Views
- Exports
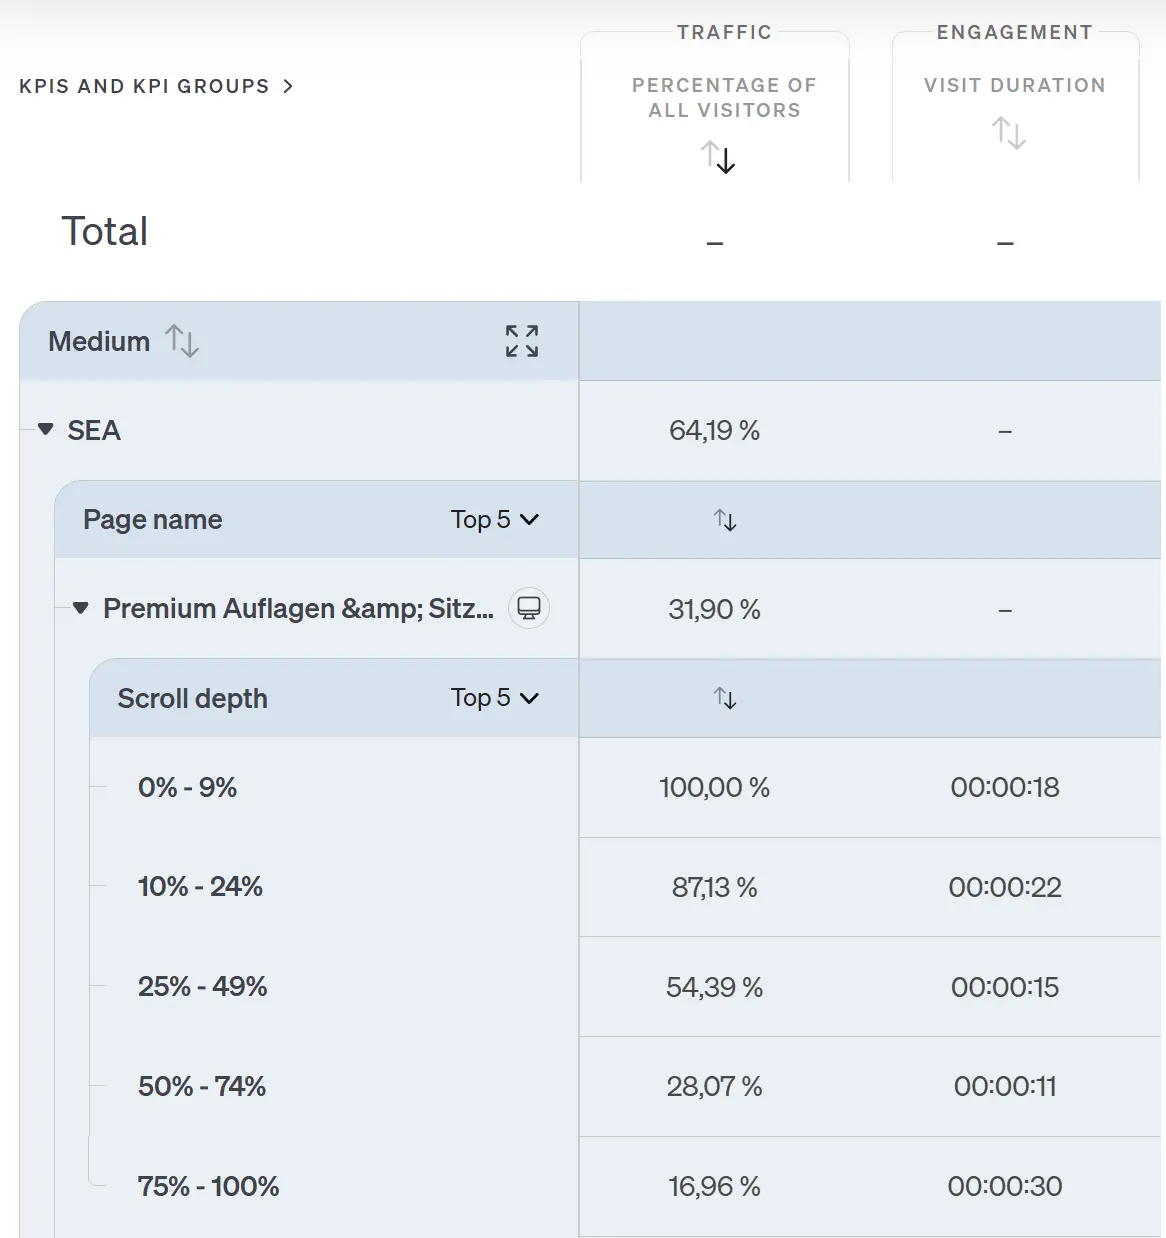
The drill-down function by adding further segment dimensions is particularly useful:
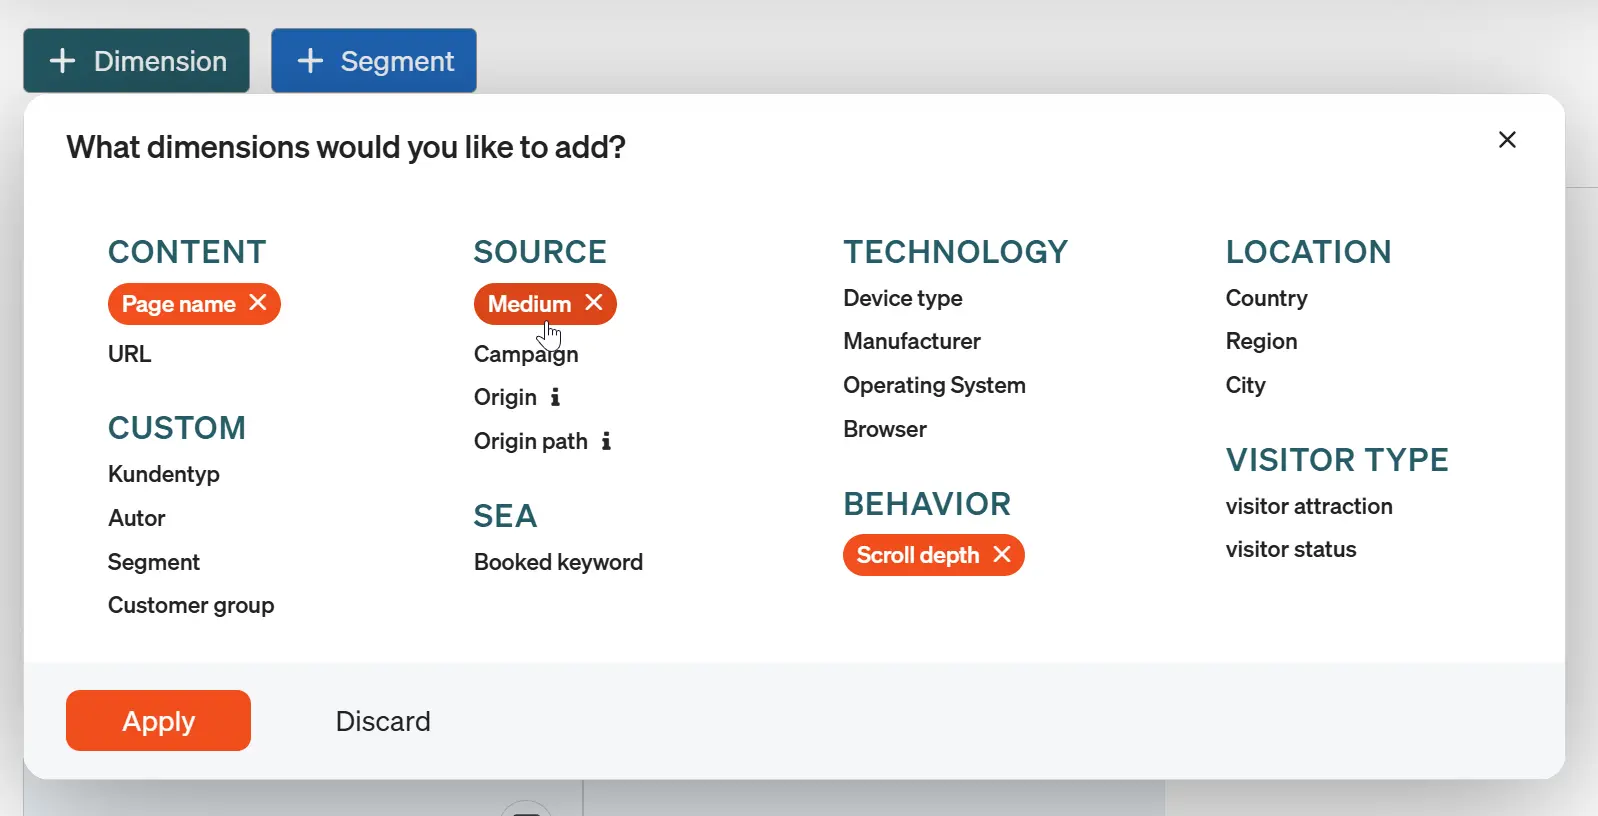
This makes it possible, for example, to view and compare scrolling specifically for the SEA channel:
Form analysis report
Form analysis enables forms to be evaluated down to field level. If forms are part of multi-stage processes, the individual process steps should also be analyzed as conversion processes (also known as funnel analyses) should also be configured and evaluated. If, on the other hand, only the sending of a form is to be measured, tracking via Events or conversions, e.g. via the etracker tag manager .
Tracking form fields helps to improve the user-friendliness of forms and therefore the conversion rate. Among other things, it is possible to find out which form fields are filled in most frequently and which are filled in least. It is also possible to determine which fields lead to abandonment or errors. Although many checkout processes in stores are now highly standardized, there is often potential to increase the user experience and conversion rate through form optimization for very extensive forms for applications and the like. The use of form (field) analysis is therefore recommended here.
Prerequisites:
- To be able to analyze form field interactions, you need an etracker analytics Pro or Enterprise Edition.
- In order for form field interactions to be measured, corresponding events must be integrated into the forms. To the integration instructions.
To evaluate your form interactions, open the form analysis report under UX Analytics → Form analysis.
The Form name dimension is displayed by default. Additional form dimensions can be added by clicking on the Select dimension button.
These form dimensions are available:
Form name
Represents a form on the website. The value is passed as the second parameter each time etform.sendEvent is called.
Section
Represents a unique part of a form, e.g. a tab to be edited or a page of a multi-page form. The value is transferred as the value of the sectionName field of the object in the third parameter.
Field name
Represents a single form field, e.g. a single text field. The value is specified in the name property of a field object
Field type
Represents the type of an individual form field such as dropdown, text or selection. The value is defined in the property type.
The following key figures are available in the report in addition to the traffic key figures:
Form Impression
The number of formView events sent by the customer.
This key figure is explicitly incremented when a formView event is sent.
This key figure is implicitly incremented if no formView event is submitted, but other events for this form are submitted for the first time, e.g. formFieldView. An implicit count only takes place once during a session, unless the user calls up another form in the meantime.
If the user switches between forms, the next event is counted again. The sending of
etForm.sendEvent('formFieldsView', 'Kontaktformular',
     {
           'sectionName': 'Adressangaben',
           'sectionFields':
                 [
                       {'name': 'Anrede', 'type': 'radio'},
                 ]
     }
);
etForm.sendEvent('formView', 'Bestellformular');
etForm.sendEvent('formView', 'Kontaktformular');
generates two form impressions for the contact form and one for the order form.
A session change between the calls of a form ensures an increase in form impressions.
Interaction (unique)
The unique interactions with a field/form per visit.
Interaction (multiple)
All interactions with a field form.
Error
The number of errors with a field/form.
Conversion
Number of successfully submitted forms.
Conversion rate
Number of successfully submitted forms per visit.
You can find out how to integrate the form analysis report here.