Basic reports
Page Value
Page value is a measure of the economic relevance of page content. It indicates the extent to which certain content promotes the success of the website. If a page is accessed particularly frequently by visitors who subsequently make transactions during their visit, this page is given a correspondingly high page value. As an online retailer, it is important to evaluate pages not only in terms of their popularity, i.e. against the background of page impressions, views per visit, entries, exits and bounce rates. In eCommerce, economic success is decisive. Particular attention should therefore be paid to pages that have many hits or a high number of visits but a low page value. Or conversely, pages that have few visits but a relatively high page value. The page value is therefore very helpful as an indicator for pages that increase conversions and sales. The value is calculated as follows: The revenue of all potion actions in the selected time period is divided by the unique (unique) number of page impressions or the number of visits for each page. The following graphic illustrates the principle:
The page value therefore shows which websites generate sales. If a page does not appear in any visit in which a purchase was made, the page value for this page is zero. If no sales are recorded in general, the page value for all pages is zero. Naturally, the value is particularly high for the pages of the checkout process and usually also for the homepage. It is also to be expected that pages about the company or in the customer service area will have a very low Page Value. The cases in which the number of visits for product or category content does not correlate with the Page Value, i.e. many visits and low Page Value or few visits and high Page Value, are exciting and worth noting. Equally interesting is the comparison of page values with product events and conversions, in particular the number of ‘viewed’ and ‘product page to shopping cart’ or ‘product page to purchase’ rates in the eCommerce reports. You should therefore be very careful about removing or changing items from the range that generate low sales when viewed in isolation but have a high page value and therefore appear to play an important role in the evaluation process.
In contrast to marketing attribution, i.e. the allocation of conversions and sales to media and campaigns, Page Value does not distribute sales. Although page value is calculated from the sales generated, it does not correspond to the total sales across all pages. Therefore, no total is shown for Page Value in the respective reports. Page Value is rather to be understood as the number of visits weighted by sales.
In the etracker application, the key figure can be found in the etracker analytics page report under Engagement Reports → Content.
Area Value
Like page value, area value is a measure of the economic relevance of website content. If a website area is accessed particularly frequently by visitors who subsequently make transactions during their visit, this area is given a correspondingly high area value. The area value therefore indicates the extent to which certain content promotes the success of the website. Areas with a high area value have a greater impact than those with a low one. In contrast to the “Product Performance Reports”, what counts is not whether a product from the area has been viewed, placed in the shopping cart and ordered, but whether an area has been accessed by buyers. In this way, the page and area values clearly show the economic impact of content beyond the product detail pages. The area value is calculated as follows: The turnover of all potion actions in the selected time period is divided by the unique number of page impressions or the number of visits for each area.
In contrast to marketing attribution, i.e. the allocation of conversions and sales to media and campaigns, sales are not distributed with area value. Although the area value is calculated from the generated sales, it does not correspond to the total sales across all areas. Therefore, no total is shown for the area value in the respective reports. The area value is rather to be understood as the number of visits weighted with the turnover. In the same way, the values of sub-areas are not added up to upper area levels if there are several area levels. Upper areas are only assigned a value if they are also assigned unique pages, e.g. area overview pages.
In the etracker application, the key figure can be found in the etracker analytics area report under Engagement Reports → Content.
Click paths
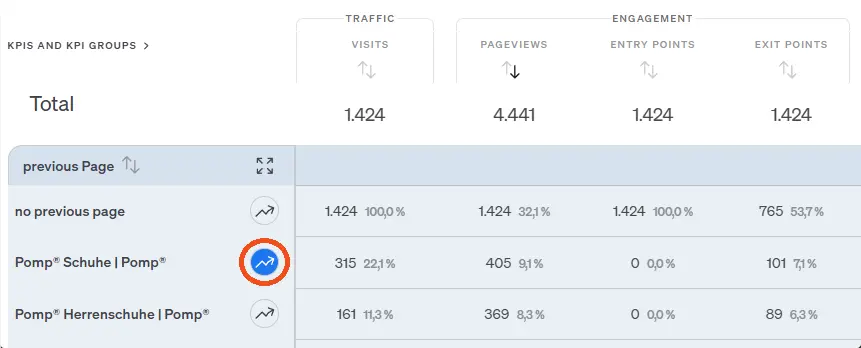
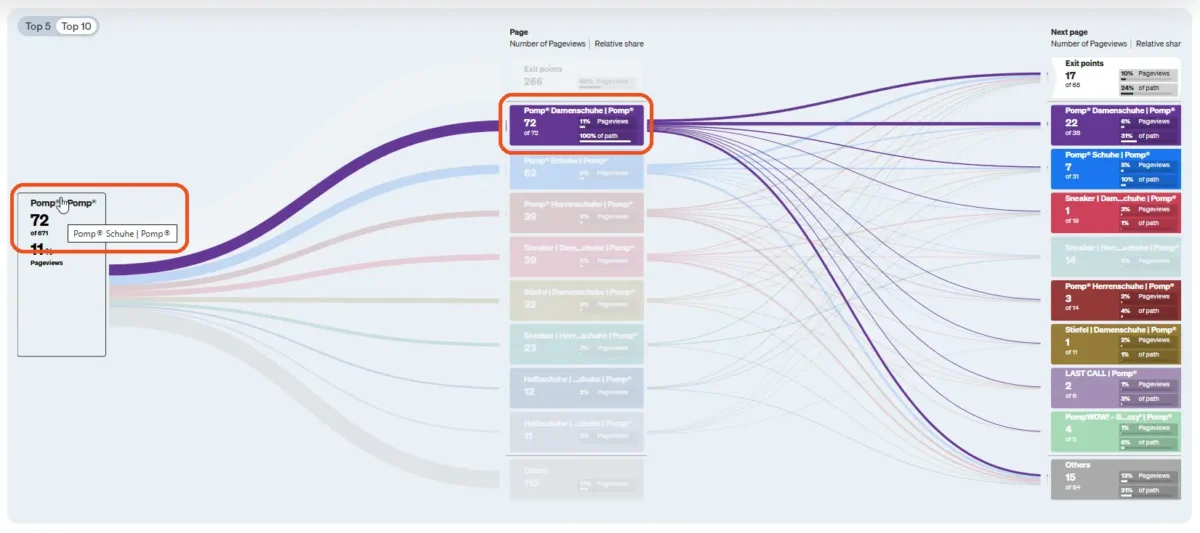
In addition to the question of the most popular and relevant pages, it is informative to look at the paths taken by visitors The sequence of pages visited is referred to as a click path. Within the click path report, the flow of visitors to your website is displayed visually and in tabular form. To do this, select the desired page in the table from which the further “behavioral flow” is to be viewed. From the page you are viewing, you can choose to analyze the top 5 or top 10 most frequently accessed pages in the visual Sankey diagram. You also have the option of clicking on one of the subsequently accessed pages to analyze an individual strand separately.