Use etracker analytics
The tracking code is integrated and tagging is configured! Now you can use the various reporting functions to derive insights from your valuable data and uncover optimization potential.
Dashboard & Navigation
After registering, you will automatically be taken to the dashboard as soon as the first data has been entered. The dashboard contains:
- Hit quota tile
- Tile with key performance indicators (KPI)
- Top lists
- News tile
By clicking on a key figure or the KPI tab, the corresponding time course and the segmentation by location, device and medium of origin are adjusted.
The top lists can be customized very easily and flexibly by selecting combinations of dimensions and key figures.
The user administration, all information about your license, the language selection and the logout function can be found in the drop-down menu at the top right. You can also switch to dark mode via this menu:
The dashboard is fully responsive and can also be displayed on a smartphone.
On the left-hand side of the application you will find the reports and various account setting options:
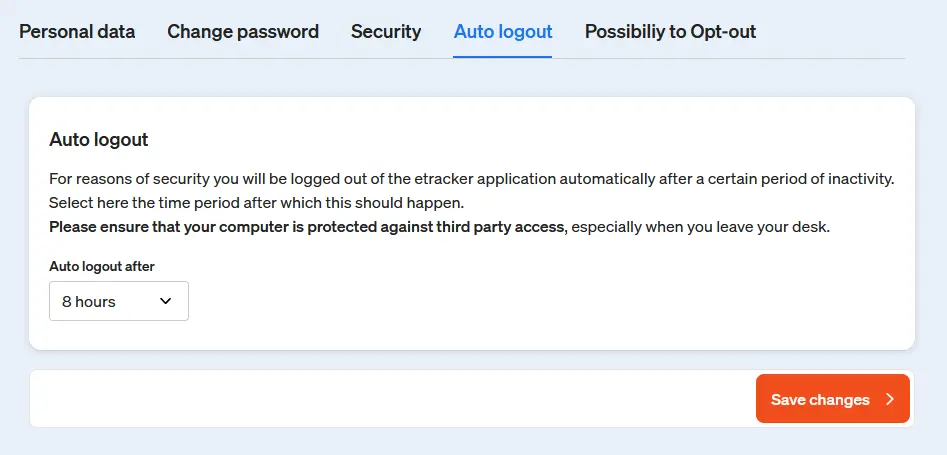
Language selection & auto logout
You can find the timer for automatic logout under Profile → My data:
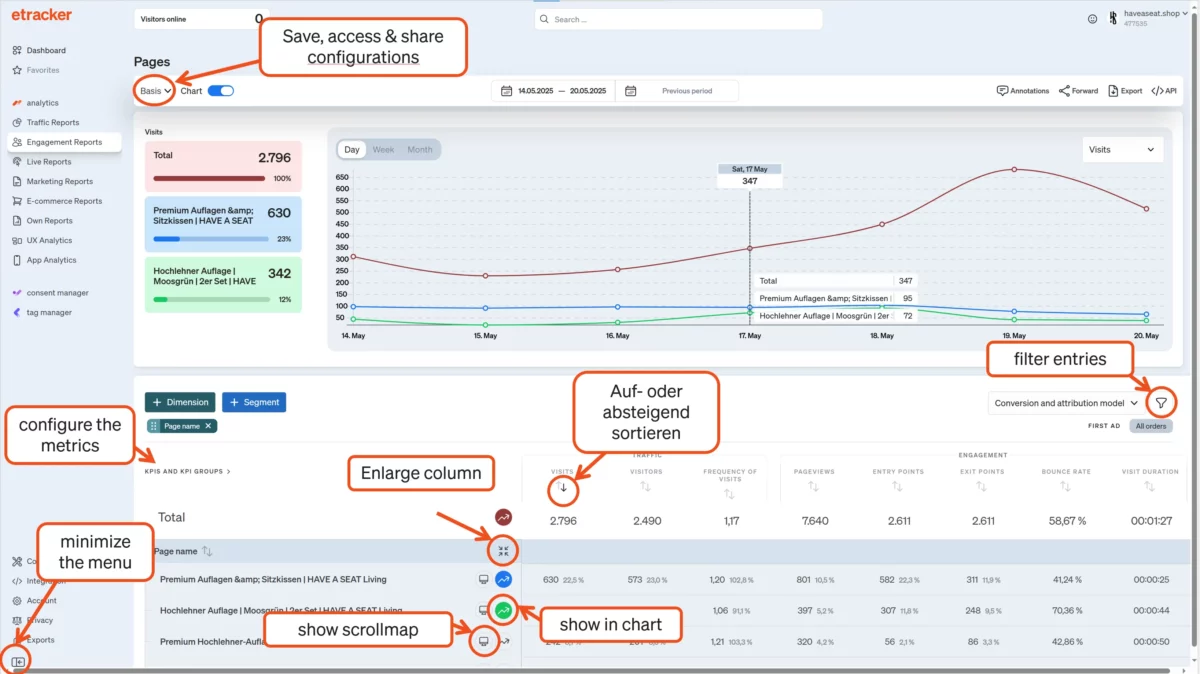
Report structure & functions
These are the central functions of the reports in addition to the period selection:
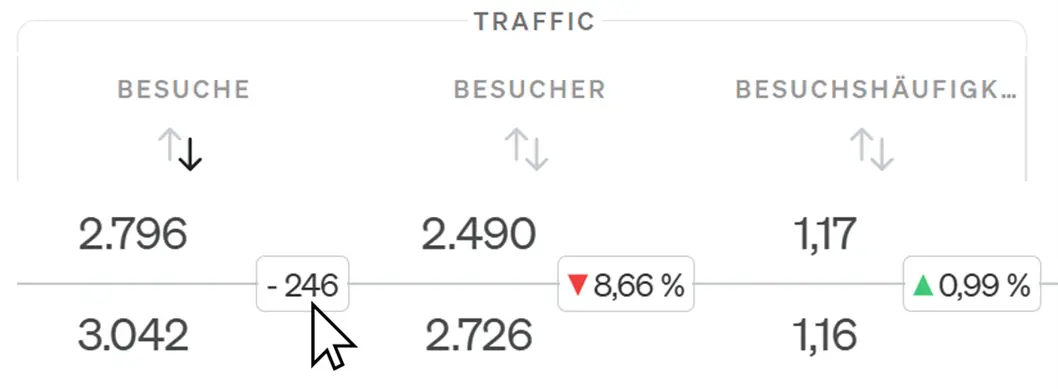
In a period comparison, you can switch between percentage and absolute changes by moving the mouse over the entries:
You can use three drill-down methods to delve deeper into the data:
- Filtering by entries or key figures.
- Segmentation according to additional dimensions.
- Create and select your own behavioral segments.
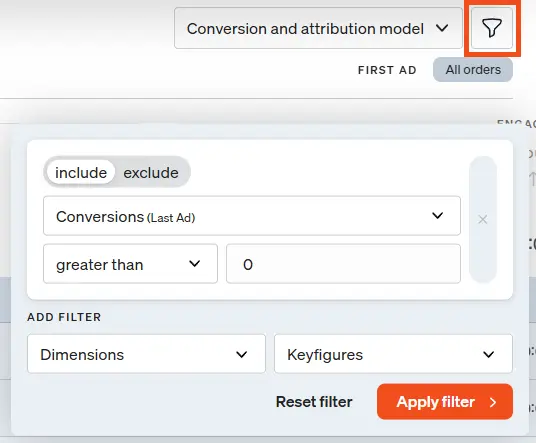
You can use the filter to limit the displayed entries (rows). Use the simple filter to select in the dimension and the advanced filter to select in dimensions and key figures:
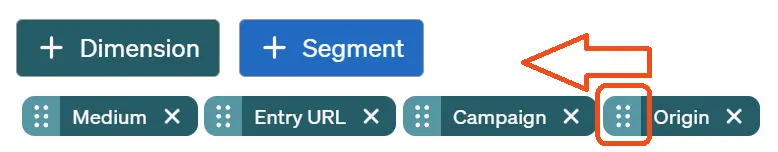
Click on +Dimension to add additional segment dimensions to the report. The most important dimensions are displayed directly for selection. The selection can be expanded via + Show all dimensions.
Depending on the etracker analytics edition, you can display up to five dimensions. You can also change the order of the dimensions flexibly by moving the respective dimension to the desired position using the mouse on the handle with the six dots.
If you want to filter for a specific behavior in the visit, select segmentation. By clicking on +Segment, you can access your own segments that have already been created as well as create new ones.
Data for your own behavioral segments is available immediately and retrospectively in the reports. They therefore do not need to be configured before data acquisition.
Three special reports: click paths, conversion processes & scrollmap
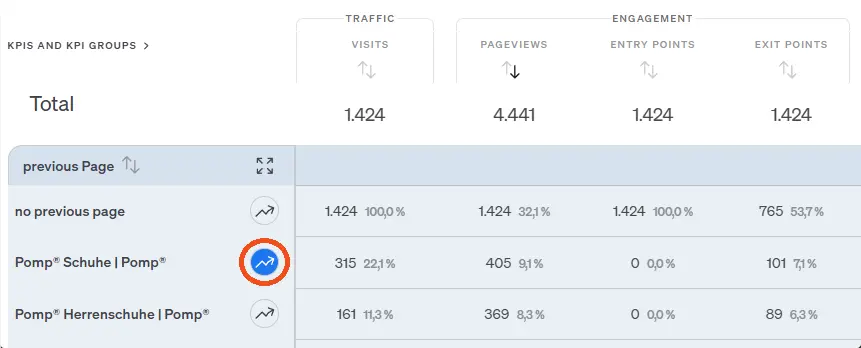
The click path report shows the sequence after a selected page in two stages:
- The pages that were accessed immediately afterwards and the exits.
- The pages that were subsequently accessed second.

You can select the respective starting page from the list below:
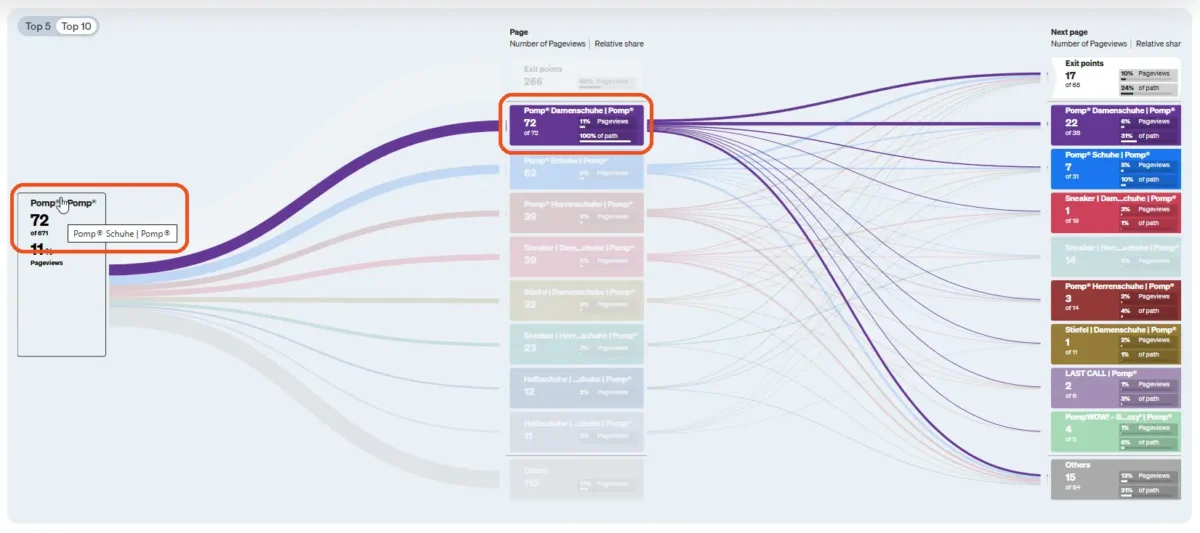
These two click path functions are also available:
- Show complete page names via mouseover
- Select a page to filter the following pages
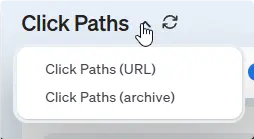
If the page name is fed from the page title by default (which can be changed via Account → Automatic entry: Page names ), but the URL is more suitable for the analysis, the click path analysis can always be switched to the page URL. To do this, click on the arrow to the right of the report title and select Click paths (URL). Note that it is not possible to switch back and forth.
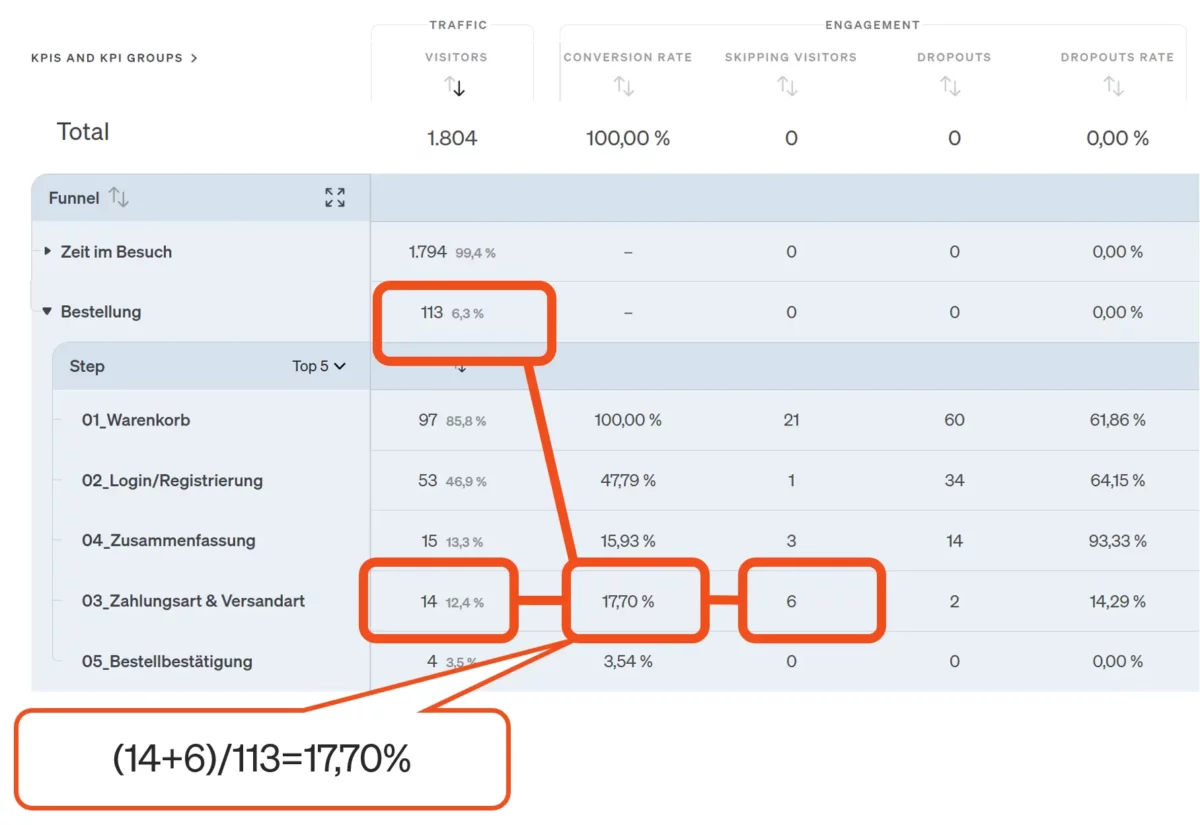
Conversion processes can be configured under Configuration → Conversion processes by combining page views or click events into steps of a process funnel.
The evaluation provides important insights into terminations in the process. However, the conversion rate per step requires a little explanation: it is the proportion of visitors who have either reached or skipped the respective target process step:
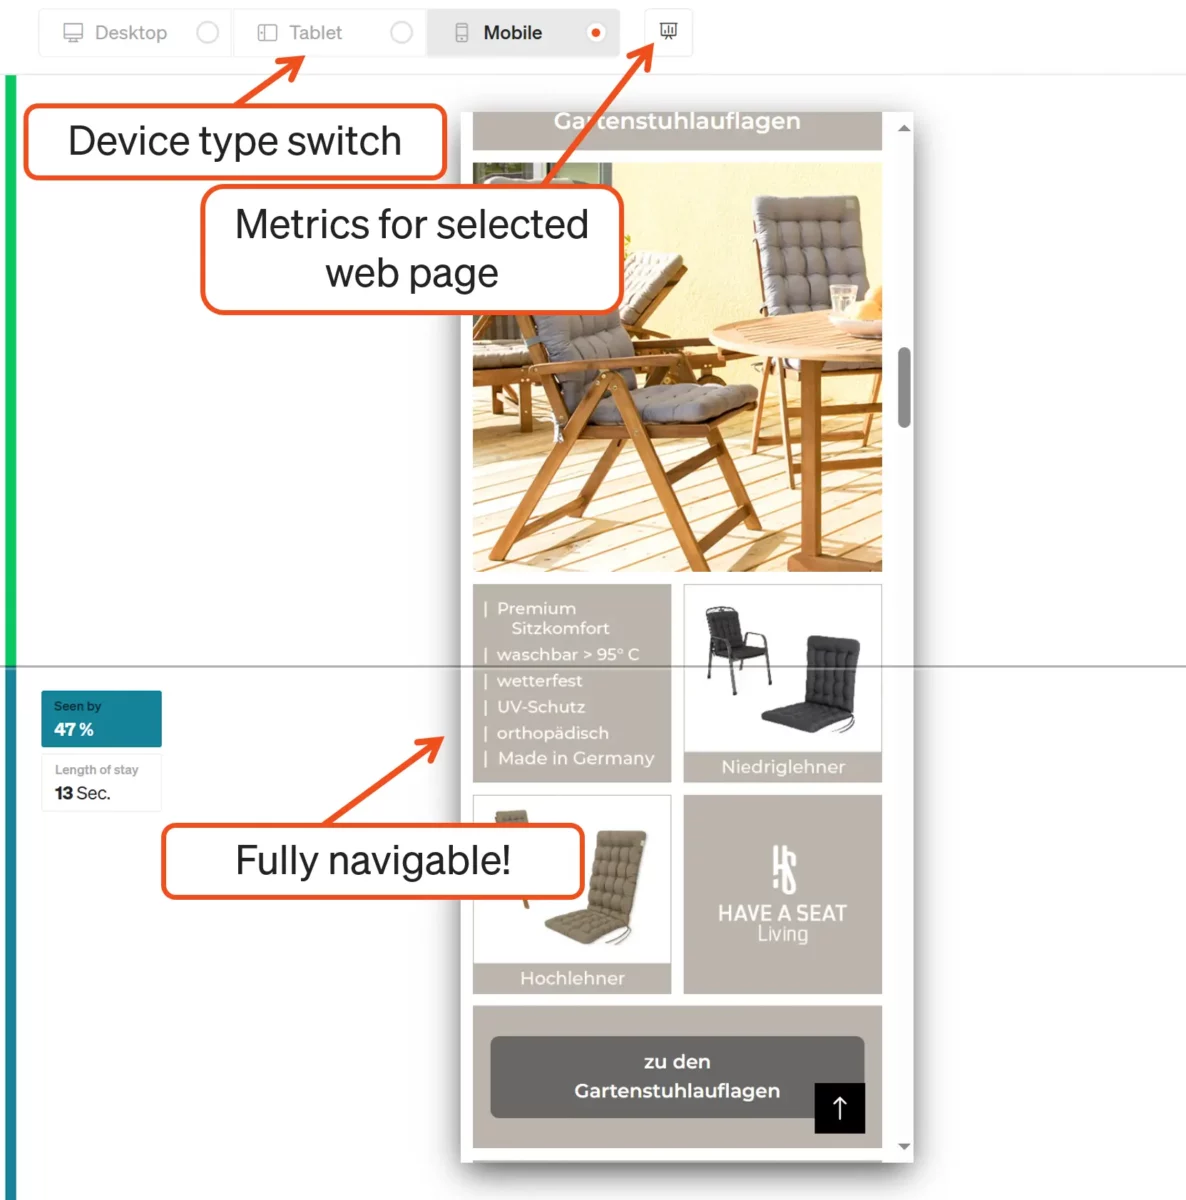
The scrollmap in the UX Analytics area also provides valuable insights into the engagement on the respective pages. The measurement is automatic. The share and dwell time per area are overlaid on the website so that analysis is possible in the context of the specific content:
Alarms
The automatic notification of major deviations helps you to react quickly. Some alerts are preset, but can of course be customized or supplemented. The important error page alert requires you to enter the appropriate page title (title tags) of the error page, such as “404” or “Page not found”. To do this, simply click on the pencil symbol for the Error Page Spike alarm and make the entry.
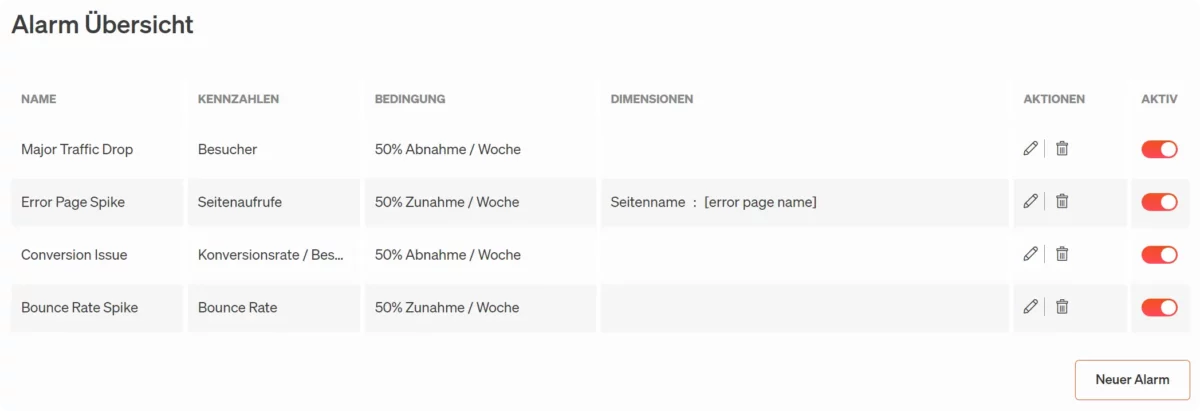
You can find the alarm function in the application here: Exports → Alarms
E-mail reporting
Data can be shared with third parties via automatic e-mail reporting without them having to access the application.
The configuration of PDF reports is limited in width due to the format, so that suitable configurations with selected key figures should be created in advance in the respective reports. These are then available for report selection.
Campaign links
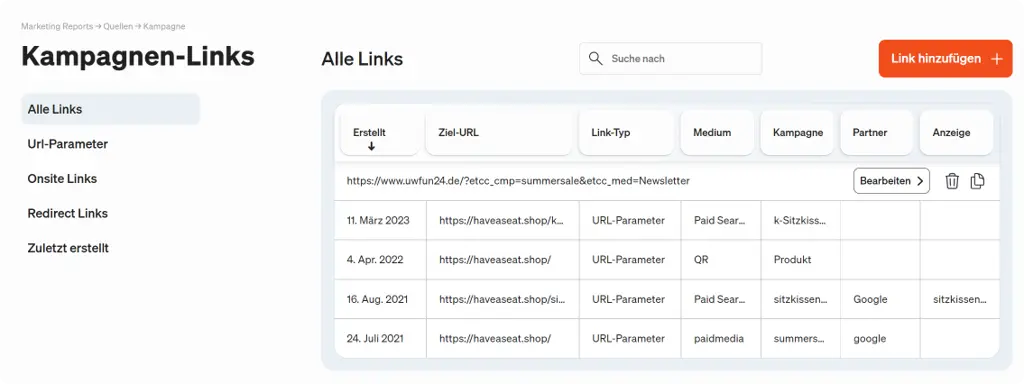
Existing campaign links with e.g. Google UTM parameters are automatically adopted and can continue to be used. The etracker campaign parameters offer additional options and can be configured under Account → Data enrichment → Campaign dimension. The campaign link configurator under Configuration → Campaign links helps with the creation of specific links.
This also allows you to save created links for later use and customization.
Further processing
On the one hand, data sovereignty means that the data is not misused for other purposes, but on the other hand it also means that it is available for use in third-party solutions via API access or raw data export.
The reporting interface can be used to access all data that is also available in aggregated form in the report interface. Queries can be easily configured via the respective reports by selecting suitable key figures etc. and then clicking on </ > API.
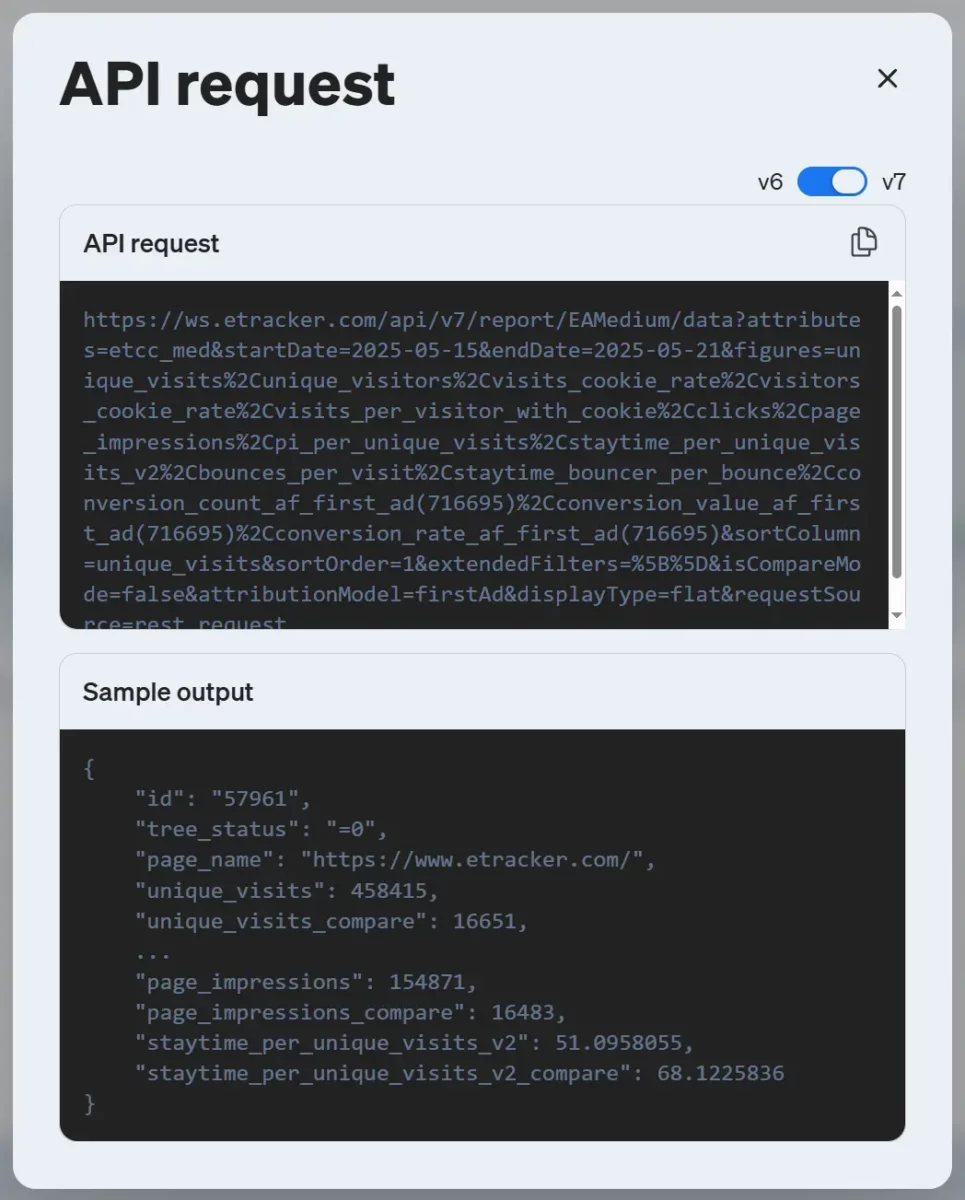
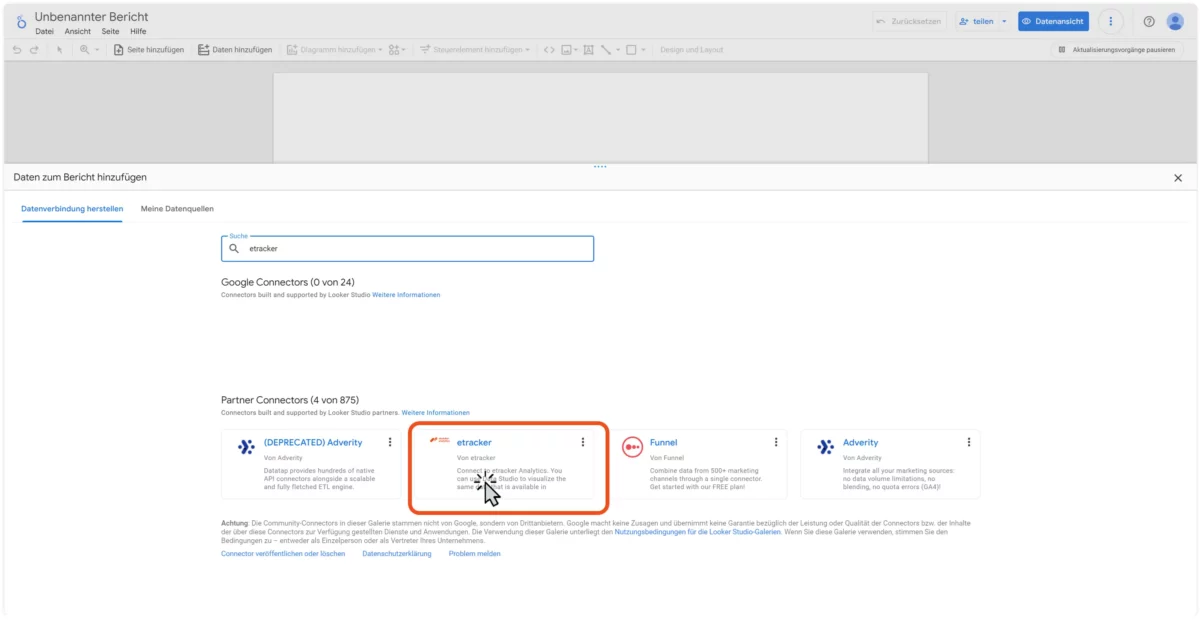
This interface is also the basis for the connector for Google’s Looker Studio.
The raw data export provides the most granular form of data with each measured interaction and the corresponding timestamp and user ID. Under Exports → Raw data export, you will find an example data set (sample) and the option to activate it for a fee (only possible in the Enterprise Edition).