Dashboard
The etracker analytics dashboard provides a direct overview of all relevant KPIs and changes. The dashboard has a responsive design so that it can be accessed via desktop, tablet or smartphone.
The dashboard includes:
- Tile with key performance indicators (KPI)
- Top lists
- News tile
- Hit quota tileThe number of visitors currently on the website,
In the top bar you will also find
- the period selection (by default, the last seven days are displayed in comparison to the previous month’s period),
- the configuration of KPIs, segmentation and selection of absolute or percentage value display.
You can also switch between light and dark mode via the account menu at the top right.
Dashboard settings
Determine whether absolute or percentage values are displayed in the top lists and the KPIs by location, device and medium.
The entire dashboard can also be filtered according to specific URL or page areas:
In addition, individual key figures of the key performance indicators can be switched on and off and re-sorted using drag and drop.
Key performance indicators (KPI)
By clicking on the KPI tab with the key figure, the corresponding details are displayed, i.e. the progression over time and the shares by country, device type and medium.
The data for the individual days, weeks or months can be displayed with a mouseover. The button at the top right can be used to expand the time history across the entire width of the dashboard.
Top lists
All six top list tiles can be customized to your own requirements by changing the dimension and/or the key figure. First, the most frequent entries are displayed for selection, which can be expanded by clicking on All dimensions >.
The current value and the change compared to the reference period are displayed for the dimension entries. The bar shows at a glance whether the key figure value has increased or decreased. The development was negative with red coloring and positive with green coloring. For example, an increase in the bounce rate is shown as negative, while an increase in visitors is seen as positive.
To delve deeper into the analysis of developments, simply click on the button at the bottom of the respective top list to switch to the corresponding full report.
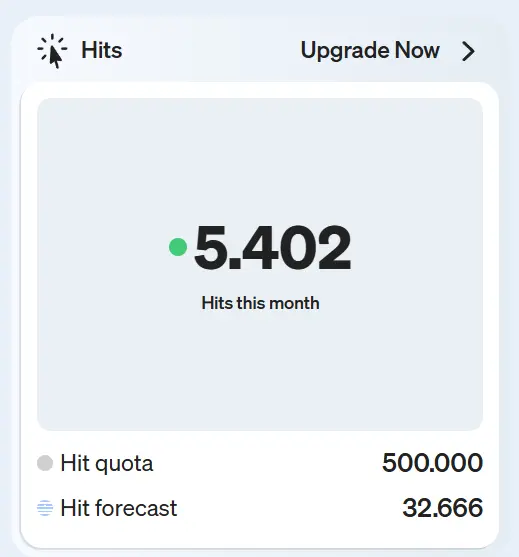
Hit tile
The dashboard provides you with the most important information about your tracking quota. The hits measured in the current month, the quota and a projection for the entire month. If the hit quota is permanently exceeded, we recommend adjusting the hit quota via the Upgrade now link >.
You can find a breakdown of hits by page views, event clicks, etc. under Traffic Reports → Hits.